| WQStat Plus is no longer available for purchase. We are encouraging our WQStat Plus users to upgrade to the Sanitas package, which will continue to be maintained and kept up-to-date with statistical guidance. We are offering substantial discounts to former WQStat Plus users. |

|
| Overview | Features | Demo | Purchase |
WQStat Plus™ has been
developed with assistance from Colorado State University faculty,
the original developers of WQStat II. A subset of the state-of-the-art Sanitas package, WQStat Plus™ is designed to provide statistical solutions for various types of environmental
media (e.g. surface water, groundwater, etc.). This powerful reporting
and analysis tool is provided in a Windows-based environment.
WQStat™ is designed for the more experienced user who is familiar with the underlying assumptions of statistical methods, and it provides distributional pre-tests but does not automate them. It is also an ideal statistical software program for projects requiring a small volume of statistical analyses.
For instance, in deciding whether to construct a nonparametric or a parametric test, WQStat™ (unlike our Sanitas™ package) requires the user to manually test each data set for normality, and construct a statistical test based on those results. Plots are generated in single-plot format, and printed in the same manner. Sanitas's Summary Tables and Batch report features are not available in WQStat Plus™.
The other key difference between the two programs is their software licensing. Sanitas™ is licensed on a per-facility basis requiring a site license for each facility (and no restrictions on the number of users). WQStat Plus™ is licensed per-user, allowing one installation per software purchase.
- Summary Statistics
- Time Series, Multiple Constituent Time Series, Box & Whiskers
(Seasonal & Annual), Outlier Test, Histogram, Rank Von Neumann,
Seasonality, Chi Squared Goodness of Fit test for normality, Shapiro-Wilk/Shapiro-Francia
Test for normality.
- Trend Analysis - Linear Regression, Sen's Slope/Kendall Tau, Seasonal Kendall, Shewhart-CUSUM Control Chart.
- Mean/Median Analysis
- Mann-Whitney Test, Parametric and Non-Parametric ANOVA.
- Excursion Analysis - Parametric and Non-Parametric Tolerance Interval, Parametric and Non-Parametric Tolerance Limit, Parametric and Non-Parametric Confidence Interval, Parametric and Non-Parametric Prediction Limit.
| System Requirements | WQStat Plus Users |
|
|
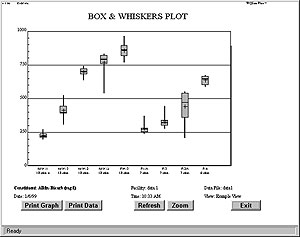
| WQStat Plus offers a suite of descriptive statistical tests to help you focus further analyses. | |
|
|
|
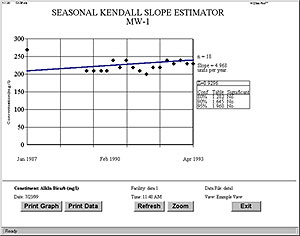
| WQStat Plus offers the Seasonal Kendall Trend Test. | |
 |
|
![]() View a side by side comparison of
our products.
View a side by side comparison of
our products.


